Get Your MJO On

Get Your MJO On
While the southern states are shivering under relentless polar intrusions, to the north of the country it looks like we'll see increasing tropical activity into the final week of the year.
It's time for a little refresher on the bringer of tropical instability - the Madden-Julian Oscillation (MJO).
As the Southern Hemisphere transitions from spring into summer, the sub-tropical high pressure belt shifts further south. This is in reaction to the warming and expanding air in the tropics, and the westerly storm track retreating towards the pole.
Meanwhile, Central Australia also heats, creating areas of low pressure (because hot air rises) which draw in north-west winds from the tropics. This reversal/switch of winds from south-east trades - linked to the seasonal position of the sub-tropical high - to the north-west is known as the monsoon. Also, the area of convergence between the south-east trades and north-west breezes is called the monsoon trough.

The north-west winds usually contain moisture, transporting it south from the tropics, while the south-east trades are comparatively dry. Hence the arrival of tropical moisture during late spring/early summer to northern regions is linked to the north-west monsoon.
The bulk of the moisture falls along and north of the monsoon trough, however it isn't consistent; there are active and inactive phases. These phases are linked to a wave of tropical activity that circles the globe called the Madden-Julian Oscillation (MJO).
When the MJO becomes active, it activates the monsoon trough, bringing increased instability, moisture, and tropical storms. If conditions are favourable, we'll also see the formation of tropical cyclones. Favourable conditions being sea surface temperatures over 26.5°C and weak upper atmospheric winds (wind shear).
Currently the MJO is inactive but it's forecast to increase in intensity while passing through the Indian Ocean next week before moving towards the north of Australia and the Coral Sea around Christmas time.
Below is a forecast chart for the MJO. The further away the lines are from the centre, the greater the intensity of the MJO. The multiple shaded lines indicate varying model forecasts (ensemble), with the mean of the ensembles shown in black.

MJO ensemble forecast for the coming weeks. Note the black (mean) line moving into the Australian region while intensifying (spreading out from centre)
Making sense of the above MJO forecast, we'll likely see a couple of weak tropical systems forming in the Indian Ocean during the coming week ahead of a more significant system in the Coral Sea into the last week of the year.
The formation of any tropical storm relative to swell potential depends on a lot of wide ranging factors, but keen weather watchers will have plenty of time to peruse the long-range charts over the coming fortnight.
Hopefully the MJO behaves as forecast, gaining strength while moving to a position north-east of the country. If it does, the chance of a late Christsmas present are very high.
Comments
Interesting read, delved into meteorology a bit for my coastal engineering degree and found it really interesting. Been keen to gain a better understanding so I love these articles you guys put up discussing this, IOD, SAM etc.
Also frothing for some waves hahaha
Farkin cold here in South Oz... Farkin beanie on IN DECEMBER!!! Warm in the sun but when it disappears... Oooo it's chilly
Beanie and jumper today singlet and thongs for the next few days, bullshit weather and bullshit waves.
Typical Top End xmas..
Once thought the Gulf was like a vacuum sucking moisture inland...
There are guys whom ride 500ft wind waves up there...
Well written but the mjo is not in the phase marked on the plot.
Tweet
See new Tweets
Conversation
Anthony Masiello
@antmasiello
The MJO is not in the IO. It is in the Maritimes and will continue to progress into the Pacific for the remainder of the month. Extratropical feedback helps extend Pacific Jet/anticyclone eastward. The PNA signal is real (in case you had any doubts).
6:59 AM · Dec 15, 2022
Interesting. Would like to see the proof? He's just stating that with no data.
Everything I see is pointing to it being around the Indian Ocean region, outgoing long-wave radiation is being reduced there and we're seeing anomalous westerly winds at 850hPa as well.
Also this is a handy chart to show the location of relevant forcings. Black solid line = MJO.
Cruisin, here is the BOMs climate note from one week ago:
"Multi-week forecasts indicate atmospheric conditions will likely become significantly more favourable for rainfall across northern Australia in the coming fortnight. There are indications that monsoonal conditions, widespread rainfall and cooler weather may develop near northern Australia. One component of this is related to favourable Madden–Julian Oscillation (MJO) activity, while a strong burst of cross-equatorial winds heading towards northern Australia from the northern hemisphere is expected to complement the influence of the MJO. Both ingredients are historically associated with active monsoonal conditions, and they are both predicted to develop in 1-2 weeks. If this occurs, it would be in line with the average monsoon onset date at Darwin in the last week of December"
http://www.bom.gov.au/climate/tropical-note/
Here's the BOMs Climate Driver Update from Dec 20:
"The Madden–Julian Oscillation (MJO) is expected to move across the Maritime Continent and Western Pacific regions over the coming fortnight, which may lead to increased westerly flow and rainfall across parts of northern Australia. The influence of the MJO may lead to the onset of the Australian monsoon during this time, while also increasing the risk of tropical low and cyclone formation across the region."
http://www.bom.gov.au/climate/enso/
Canm RMM1 17/12/2002. Unfortunately this site has no feature to post the plot data graphic
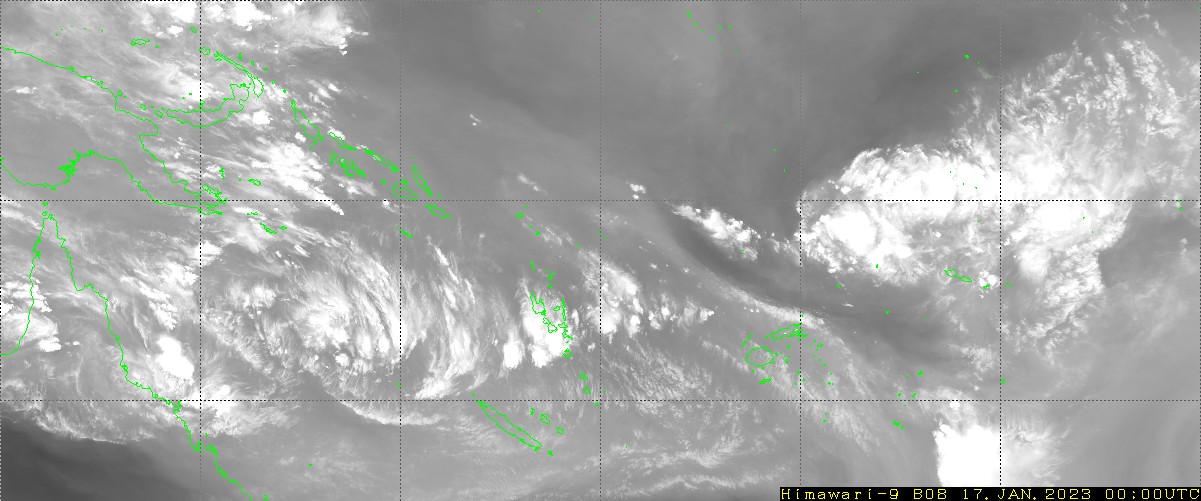
MJO appears as a very weak signal in pahse5.on the plot. Also take a look at live satellite data
you can see where actual convection is. .
Agree. Currently weak and hard to discern where exactly it is right now. Convection south-west of Java resulting in TC Darian looks to be linked though. Regardless lets hope it strengthens as forecast when it moves into the Western Pacific.
Our friends up north have some good images on there met service page sat images and wind plots.
Scrolling down from the top of the page you find em. Very cool looking eq rossby wave (n-1) north and south of the eq shown on a plot. There be the link to the mjo on that plot. Cyclonic cloud curvature also noticeable over nth of the top/end on real-time satellite.
https://www.bmkg.go.id/?lang=EN
https://earth.nullschool.net/#current/wind/isobaric/850hPa/orthographic=...
https://www.atmos.albany.edu/student/abentley/realtime/subtrop.php?domai...
Some more realtime data atm supporting above. This data will how ever change as day pass.
Irro wind shows the signal in the maritime nth of the topend. Should be enough data now to give a decent hint for anyone interested ..
Tropical Cyclone Darian, perfection..
Wow i did read somewhere you are a meteorologist Craig. No affence intended man but perfection?
lopsided with ragged eye on that satpic.
You set the bar way to low atm with this storm perfection is 140kts sustained cat5 for a tc with a perfect even symmetric eyewall.
Hard taskmaster Cruisin!
Maybe he likes the asymmetric features of the cloud bands?
Haha, you take things a little too literally. I am just admiring the cloud bands.
https://imgur.com/a/dnHY18x
Darian
Not for me needs alot of work for perfection.
The other storm Invest 90S brewing closer to the main land up north maybe the one to watch if it gets some shear free conditions.
Darian got its act together over night. Currently on sat appears to have been dropping the banding
and gone annular in structure huge improvement over 12hrs.
CI# /Pressure/ Vmax
7.0 / 921mb / 140kts
Nice to have a TC afficionado in the place Cruisin.
Beautiful!
Bit of cloud in the eye Craig- 5/10
Ha!
Cloud seen within the eye on the sat posted appears to me to be likely the initial beginning of the onset off a eye-wall replacement cycle. When it does complete the system may well have huge eye span in n/miles. How long it does take with all going well is anyone guess atm. They can be finicky
at the best of times. But yeah atm a very intense robust cyclone.
So, is NW Aus about to turn the fk on then or what !?
Nah, the bulk of the swell generating winds are on the southern flank..
Would be a nice swell producer for the Maldives if the storm track wasn't perpendicular through the window.
Haha was literally coming back to check which way the winds were spinning off it. Too bad, looks meaty as!
Head for this spot adsi:
https://goo.gl/maps/tuj1oa5oxvRWJuBa6
Hahaha surf potential not withstanding, it looks like a pretty nice spot!
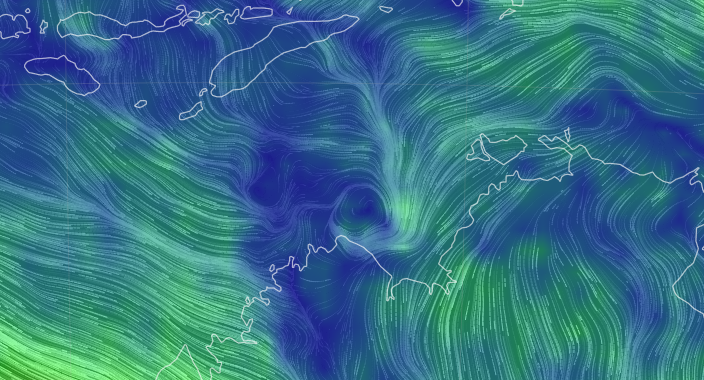
Here's a great illustration of the South Pacific Convergence Zone. Area of convergence where south-east trades from the sub-tropical high meet the easterly trades in the tropics.
It's further south-west than normal owing to the La Niña signal.
Pretty
https://earth.nullschool.net/#current/wind/surface/level/orthographic=-2...
System to the nnw of the topend looking atm like a textbook monsoon depression. Has some ok midlevel rotation going atm. They can look sloppy but mostly always are a rain bomb when they find terra firma.
https://earth.nullschool.net/#current/wind/isobaric/850hPa/overlay=total...
Yep looks very interesting.
Boms tec
REMARKS:
Severe Tropical Cyclone Darian (category 5) continues to intensify and move in
a generally westward direction. Position is good based on satellite imagery and
microwave passes.
Darian continues to intensify, with increasing symmetry in the eye and surround
cloud structure. Intensity is estimated to be 120 knots (10-minute mean) based
on subjective Dvorak and consistent with objective guidance. Dvorak analysis
using eye pattern yields DT of 7.0 . MET with a D+ 24 hour trend gives 7.0. PT
agrees. FT/CI 7.0. Objective guidance estimates were: CIMSS ADT T6.7 132kt,
AiDT 131kt, OPEN-AIIR 127kt, NOAA ADT T6.7 132k (all 1-minute means). There
have been no recent updates to SATCON.
Darian is expected to continue moving westwards for the next few days due to a
firm mid-level ridge to the south, and will move into RSMC La Reunion's Area of
Responsibility this evening. The environment remains favourable with
well-developed outflow channels, low vertical wind shear and decent moisture
inflow at all levels. SSTs are near 27 degrees C, slightly warmer to the west
of 090E. The forecast intensity decreases slightly during Thursday as Darian
becomes a little disconnected from upper outflow, but then intensity may
increase again on Friday as an upper trough to the south increases ventilation.
From Sunday shear may increase and Darian should move south over cooler waters,
which should result in weakening.
Copyright Commonwealth of Australia
==
The next bulletin for this system will be issued by La Reunion RSMC.
Must be some waves on the East coast of Madagascar from it.
The Tropical Depression up North has got some massive convention busts going on sat.
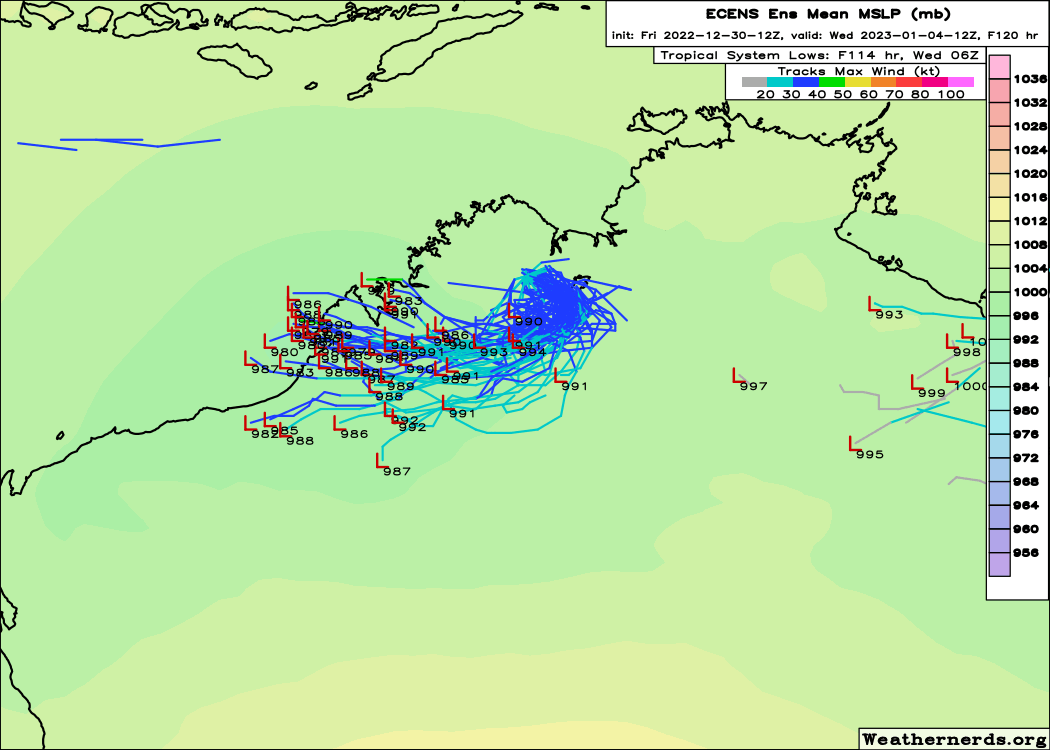
Ens forecast track. Be some swell about if you are game enough to paddle with croc's.
Bubbling away.
Indeed it is brewing away. 18z hwrf thinks it may also wrap tight rapidly. Remains to seen in realtime if it get enough clearance to tho.
Possible tropical cyclone developing Friday morning before crossing the coast near the NT/WA border.
http://www.bom.gov.au/products/IDD65011.shtml
Realtime earthweather showing its cell now reaching upto 200mb so yeah that's the established ouflow point achieved with that it should do better overnight when the atmosphere cools.
250mb plot1 below.
plot2 mid-level winds and moisture feeds.
Just a heads-up though you're probably aware, Earthnull is all forecast data and not observed.
Infrared - Zehr have the glimpses of the cloud tops reaching -90°C. High, deep convection.
A few overshooting tops (towers) on visible above sat.
Think myself just viewing sat wont be long before the JTWC up grades this to a tropical storm. looks about 35-40kts atm to me i think.
Bom may take longer given they a bit tougher with classification.
No real surprise JTWC update with the upgrade . Cant be named until the bom names the cyclone being the officials in this AOR.
SUBJ: TROPICAL CYCLONE 06S (SIX) WARNING NR 001
WTXS32 PGTW 220900
1. TROPICAL CYCLONE 06S (SIX) WARNING NR 001
02 ACTIVE TROPICAL CYCLONES IN SOUTHIO
MAX SUSTAINED WINDS BASED ON ONE-MINUTE AVERAGE
WIND RADII VALID OVER OPEN WATER ONLY
---
WARNING POSITION:
220600Z --- NEAR 12.8S 129.1E
MOVEMENT PAST SIX HOURS - 190 DEGREES AT 10 KTS
POSITION ACCURATE TO WITHIN 030 NM
POSITION BASED ON CENTER LOCATED BY A COMBINATION OF
SATELLITE AND RADAR
PRESENT WIND DISTRIBUTION:
MAX SUSTAINED WINDS - 035 KT, GUSTS 045 KT
WIND RADII VALID OVER OPEN WATER ONLY
RADIUS OF 034 KT WINDS - 000 NM NORTHEAST QUADRANT
000 NM SOUTHEAST QUADRANT
040 NM SOUTHWEST QUADRANT
000 NM NORTHWEST QUADRANT
REPEAT POSIT: 12.8S 129.1E
]
Nice drink for the top end.
Yeah model totals for over a large region of the NT looking wet aswell the depression dragged the mt trough along with it.
BOM Ens plot 2
Great visuals!
FIFO mate of mine just got out of the region before the heavy falls.
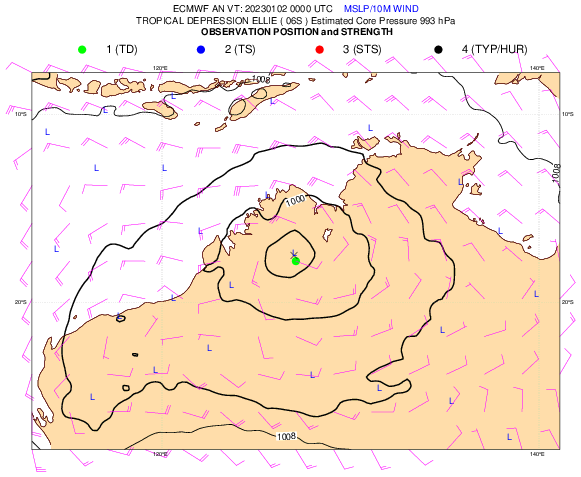
The remnants of the former tc Ellie have been persistent over the Topend and now over nw WA. The remnants have had a lifeline to hang about from the mt feed. EC ensembles atm are weighted in the favour of a regeneration offshore re: plot1.
Access atm thinks the vorticity will not wet its feet again over warm waters offshore. It does however deepen the depression overland with the mt feed and see's the nnw feeder band re plot3 that is now fragmented hook up to the center of the vorticity. Access then see's a trough captures the inland depression tracking it in ssw track.
A pesky big wet slopy mess.
You familiar with the Brown Ocean effect Cruising?
Yeah indeed i'm aware of savanna landphoons.
Looks to be a classic case right now.
Is that the way you see it?
Yeah i agree with you on that current analysis. What will be interesting if the energy does go
offshore asper current ec ens think it may. Will it keep its former name. Or will it be tagged and renamed again with a different identity if ec ens verify the energy menders and don't get captured by a weakish passing trough and is steered by a building str.
Interesting scenario's on the table atm with this feature.
freeride76 SATURDAY, 31 DEC 2022 at 10:56AM
Looks to be a classic case right now.
Is that the way you see it?
Ellie
May well be something on the table with it around exmouth wa. Laters maybe for Jason Harris.
Hi all, can anyone here shed any info on expected rainfall for Bali mid to late January based off the current charts?
I’m thinking of going for a quick strike mission but won’t bother if it’ll be raining the whole time.
Thanks in advance
10TH to 18th looks ok atm to me re Bali rain question. The question may have been for Craig
not wanting to step on any toes here just my 2 cents.
Thanks Cruisin. The question was for anyone who has an idea of reading the the long term charts, because I have no idea…
Happy New Year to all and thanks for the hours of content SN
Nah go for it and thanks, I've been offline.
plot1 precip tally forecast over the next 4-5 days is at the end of the scale roughly 700mm on Broome's coast region.
EC atm wanting to give Broome a big drink and likely big gusts aswell when wind filters down.
looks on sat to be slowly developing even tho it's centre is on terra firma.
The bands on depressions can be hundreds of kilometers in length away from the actual centre of the low.
wsw wind speeds and shifts in coastal area's such as kuri bay suggests to me that this feature could be a well-marked tropical low by the official agency (BOM) however it's not classified as such atm.
AUSTRALIAN REGION (longitude 90E eastward to longitude 160E)
MSW Averaging Period: 10 minutes
Tropical LOW - term is used to describe disturbances ranging from
diffuse, ill-defined low-pressure areas all the way to well-
organized tropical depressions with MSW up to 33 kts
Tropical Cyclone - MSW in range of 34-63 kts/ Dvorak rating ranging
from a strong T2.5/weak T3.0 to T4.0
Severe Tropical Cyclone - MSW exceeding 63 kts/ Dvorak T4.5 or
higher
Impressive.
V. much so.
What's interesting to me is the way it has anchored and maintained the W-NW monsoonal flow across the top end and into CS.
In effect it has placed the maritime continent in the centre of a large semi-stationary monsoonal gyre.
Even tho quite a few hours old the last ssmis pass over the feature did show the embedded centre quite well.
It's hard for me to ignore. It's not classified as a tropical low locally. But that's just the way it is in our neck of the woods.
realtime radar tells the current story. Not sure what else they are looking at in realtime.
Shuggz enough from me.
Quote.
The head of WA's emergency services, Darren Klemm, has labelled the situation "the worst flooding event our state has ever seen", with authorities frantically working to rescue impacted residents. Ex-tropical cyclone Ellie has battered north-west Australia over the past week, with the Fitzroy River reaching record-breaking levels.
WOW to this dude. https://www.ski.com.au/xf/threads/2022-23-australian-cyclone-monsoon-sea...
Public interest Notice.
Steer Clear.
Wow it's doing the whole Do-si-do up north, still hanging in there.
re: two posts above.
Indeed, thus why not it's never a good idea to underestimate or belittle a tropical depression.
The continuous monsoon rains over the area were brought about by xEllie triggering massive flooding.
https://cleanet.org/resources/47829.html
Usually very up to date with plane, balloon, station data from the global forecast input data as it comes in and is assimilated into real-time wind data its claimed.
cheers.
Almost three weeks!
EC verifications data page.
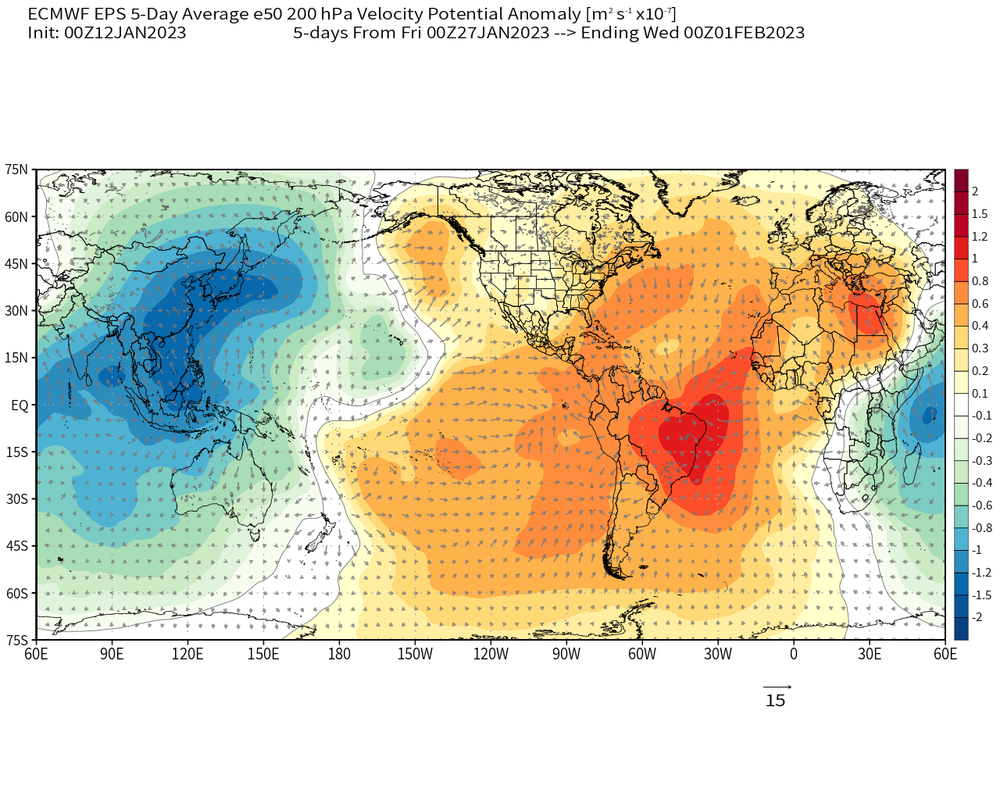
EC eps ens forecast VPA displays a strong maritime mjo again in last last week of the month.
.
Walker cell circulation boosting maybe.
Yeah possibly.
Those trades keep coming and we didn't really seem to get much of a Nina killing WWB from the last MJO.
Yeah that's the chaos. Climate models relying on climatology algorithm's will keep showing plumes heading into neutral to warm territory. As you said kw's have just eroded way. And easterlies have dominated over the date line. With no wwb penetrating east of the dateline and the walker cell's position atm cooling the uppers. Myself until we do see evidence of kw's and wwbs and the walker cell shifting east the chaos in trying to predict the next 6 months inline asper the current enso modeling tools is doubtful, And they should be used with caution. Opinions are my own so don't give em any weight when coming to your own conclusions. I do like to see other people's opinions not just modeling. Hope it makes some sense.
Cheers.
It's fascinating to watch each Kelvin wave dissolve and the MJO being held off to the west as those trades keep going.
We'll be heading into some unchartered territory if it keeps persisting.
Likely the current flooding up North is being fueled by a west moving equatorial rossbywave.
lots of vertical uplift.
Re above.

With our audience you'll have to explain in a bit more detail exactly what you're posting graphically as most wouldn't be aware of the outgoing long wave radiation charts, and what to look for.
Or know what a Rossby wave is :)
The gyre (MG) setup appears to me to be because of the equatorial rossby wave's energy dispersion over the region. Craig is likely not to be happy with the lack of information without in depth detail with this post. Buts that's how i see it and how i roll.
Cheers
I've got no issues, it's just if you want to attract more engagement and discussion of what you're posting from the greater Swellnet community.
You're very knowledgable but for others to follow you might need to explain things a little.
Took me a while to decipher that second image.
Kinda cool to go down the rabbit hole searching for Rossby!
SAM, Kelvin and Rossby walk into a bar…..
Haha.
It's notable and seems weird that out of all the lows which have budded off the Monsoon trough in the last 3 weeks, not one has been able to form a cyclone.
Not even close.
Cruising, do you have a take on this?
Too much shear?
Yeah shear has been the killer. Futher east however nine has found some good conditions and is already a cyclone and most likely should ramp up. It was also embedded along the mt.
You can see areas that are hostile re shear on the above plot.
Love your input Cruisin. Sign him on SN.
Nine was named and upgraded overnight. https://www.vmgd.gov.vu/vmgd/index.php/forecast-division/maps-and-charts
Nice, yeah 92p looks to intensify to a TC now as well.
Yeah, welcome Irene.
Shame there's no recurvature.
If 92P undergoes cyclogenesis it'll be TC Freddy.
With more surf potential, at least for sub-tropical areas.
Yeah, the 92 disturbance is broad and very elongated. There is a westerly flag, so it is a closed off lpa atm. Worth keeping a eye on it for sure for any further consolidation overnight.
Purple time-stamp along the bottom is actual time of the samples pass.
Farewell Irene.
Chance of 92P being upgraded to TC status now high.
Goodnight Irene!
well played
92 has two competing vort's jumping around inside the circulation. One of them needs to locate with the other for 92 to get going. Very cool looking swpac monsoon gyre setup tho.
The gyre (MG) setup appears to me to be because of the equatorial rossby wave's energy dispersion over the region. Craig is likely not to be happy with the lack of information without in depth detail with this post. Buts that's how i see it and how i roll.
Cheers
We've seen Monsoon Gyre set-ups as a semi-permanent feature over the last month I reckon Cruisin, especially as a result (cause? effect?) of semi-stationary ex-Ellie.
For me my main interest atm is if the gyre instead of spitting out those multi se vort's the gyre itself becomes one large TC.
The mt was dragged lower over the continent by Ellie agreed. I don't recall seeing a large tilted nw to se gyre tho in the swpac.
Could be a good result for surf if it stays mellow.
Would be stoked with a week of 3ft clean mornings on the open beaches.
The MJO signal looks quite strong on the GFS plot above.
It's timing is almost in sync with the, EC eps ens forecast VPA displays a strong maritime mjo again in last last week of the month post plot on SATURDAY, 14 JAN 2023 at 6:18PM.
Yep, here comes round two.
Do you think the Broome region is going to cop it again?
Its a tad early to call any exact location atm anywhere along the stretch from, Derby to Karratha
maybe on the table atm with a possible landfalling tc in the next 2 weeks.
Would it be fair to say that the weather event currently impacting North Is. NZ is their version of a Black NE'er?
Nah, the wind strengths aren't there.
Ben Noll covers it well..
And to put it in perspective..
Thanks for the info.
The current setup looks mental. Could be a mess tomorrow.
RE: Gerg twitter repost. Its been widely known and stated by (legitimate) climate scientists many years ago we would see more extreme global weather events with climate change. The Pakistan Floods being a prime example.
Marine heatwaves are drivers also in many of those extreme events.
Actual land heat waves a different beast over our continent have always been a threat even in a cooler global past environment.
Quote
Historical heatwaves
Since European settlement, there have been 11 heatwaves which resulted in significant loss of life. Some of these coincided with severe droughts, such as the Federation Drought (1895–1903), the Second World War Drought (1939–45) and the Millennium Drought (2001–09).
The most catastrophic heatwave, which was responsible for the death of 435 people, occurred between 1895 and 1896 and covered most of the country.
Indeed!
MJO Round2 being met with nina destructive interference forecast.
GFS Modeling suggesting a strong signal across the pacific.
Compare the pair.
JMA atm again showing la-Nina destructive interference repeating with it's forecast.
EC (middle) shows better strength than JMA..
This push looks to be the maker or breaker..
Actually latest update has it also possibly hitting the Niña wall..
Interesting.
Hi Cruisin - what are the colours / scale on the Vp200 forecast?
GABRIELLE looking ok with her low level structure coming together.

Alot of low-level cloud on the micro inside the centre suggests a future eyewall and mostly overnight when the atmosphere cools again.
Very nice.
Current Intensity Analysis
UW - CIMSS
ADVANCED DVORAK TECHNIQUE
ADT-Version 9.1
Tropical Cyclone Intensity Algorithm
----- Current Analysis -----
Date : 09 FEB 2023 Time : 013000 UTC
Lat : 18:03:41 S Lon : 153:25:01 E
CI# /Pressure/ Vmax
3.1 / 988.1mb/ 47.0kt
Final T# Adj T# Raw T#
3.1 3.3 3.6
Center Temp : -72.9C Cloud Region Temp : -74.7C
Scene Type : UNIFORM CDO CLOUD REGION
Subtropical Adjustment : OFF
Extratropical Adjustment : OFF
https://tropic.ssec.wisc.edu/real-time/adt/AiDT/12P.listing.txt
As expected the tc strengthened overnight when the atmosphere cooled, The further south the system tracks the more hostile the condition's will very likely become in the upper-levels.
Re above
Did not take long with the hostile uppers, GABRIELLE appearing on sat with a totally exposed centre from shear.
That's epic!
Tropical Cyclone Gabrielle, category 2, is moving quickly towards the southeast. The centre of the cyclone is expected to pass very near or over Norfolk Island this evening. Gale-force winds and high waves are likely occurring around parts of the island, and conditions may worsen overnight as the centre of the cyclone moves past.
Cat2 tropical cyclone??? Think not.
nah, jTWC classified as sub-tropical storm (SS) by that stage.
Agree freeride by that time the system had undergone a transition to a hybrid (subtropical) and a very insidious one.
Quote
Last Updated - 02/14/23
Valid - 02/22/23 - 03/07/23
During the past week, both the RMM and upper-level velocity potential based MJO indices continue to reflect coherent Madden Julian Oscillation (MJO) activity, with the enhanced convective phase having entered the far western Pacific in the past few days. During the next week, there is good agreement in the dynamical models favoring continued eastward propagation of the MJO signal across the western Pacific where it is anticipated to destructively interfere with the low frequency footprint. Notably, time/longitude forecasts of lower-level wind anomalies show a major disruption of an enhanced trade wind regime over the central Pacific tied to La Nina, with anomalous westerlies emerging over the eastern Pacific and velocity potential anomaly fields maintaining a fairly defined wave-1 pattern. As the MJO propagates across the western Hemisphere during week-2, RMM forecasts generally depict a weakening mean signal and increased ensemble spread contributing to added uncertainty later in February. Despite a potentially much less coherent MJO at this lead, the large-scale environment is expected to become less (more) favorable for tropical cyclone (TC) development in the Indian Ocean (South Pacific). The extratropical response associated with western Hemisphere MJO events during boreal winter historically favors warmer (colder) than normal conditions developing across the western (eastern) U.S., but this is at odds with the latest 500-hPa height anomaly guidance from the ensembles which maintain more of a La Nina pattern over North America heading into March.
That suggests breakdown conditions to me.
What do you see Cruisin?
What I read into that analysis is they are sitting on the 'fence'.
Copy that, cheers.
Craig what do you think about the possibly of a kona low before the end of the month?.
Will have a scope later this arvo.
I've got no idea what you boffins are talking about, do I need to know? No I don't think so, I just want more offshore waves down here in Vic so I'm following the convo and from what you're saying it seems we might be waiting a while still.
Anyway I'm curious, what's a Kona Low? Sounds fun for Hawaiians
They can be fun or they can be insidious. The reason i asked Craig what he thinks is because kona are not the easiest storm to predict. Models don't usually handle them very well because of the mesoscale features making them hard also with a future track with them out in the cpac. Nothin really boffin about the question of someone with i think may have quite a lot of cpac storms experience given this is a numero uno surf site.
The uppers look cooler than normal along with instability and moisture being fed in from the east-southeast.
So catalyst is there.
It looks to be fairly fast moving any low that does develop, so nothing too significant IMO.
I enjoy what you post Cruisin thank you. More wizard than boffin sorry. You have charts I've never seen before with mysterious anagrams to look up.
ACE for example. I'm sure plenty like Craig and Co get it and I admire their work to put it in simple English for dolts like me continually surprised by every new layer to the complexity of weather.
RE: ACE for example. https://learnweather.com/tropical-cyclone/what-is-ace-index-accumulated-...
Below no better place catch up and any information papers you can gather and read from former Dr Bill Gray.
http://tropical.atmos.colostate.edu/Realtime/
And thanks for your post Standingleft. Craig did point to me on this site i would need to supply
and explain in more detail. Understandable considering there is are subscribing member's on this site who want layman's term plain english.
So yeah i will leave it to Craig & Co from herein.
Cheers.
Thanks Cruisin, and don't leave. Love the charts and intel you bring.
I'll second that Cruisin..
Don't stop posting because of my stupid comments. It's quality Intel I think many appreciate. We can't expect you as another subscriber to take the time Craig does to explain it.
Thanks for you quick response Craig.
930
FXHW60 PHFO 150636
AFDHFO
Area Forecast Discussion
National Weather Service Honolulu HI
836 PM HST Tue Feb 14 2023
.SYNOPSIS...
A kona low about 250 miles north of the Big Island will move
steadily toward the west over the next several days, strongly
affecting island weather. Locally breezy and cool north winds will
gradually weaken through Wednesday, and then shift to the south by
Wednesday night, leading to increasing humidity. A significant
moisture surge will move over the islands Thursday, and remain in
place through at least Saturday. This moisture will fuel what is
expected to be a prolonged period of rainfall, with heavy showers
and thunderstorms potentially affecting both windward and leeward
areas of all islands, with impactful flooding possible. A Flood
Watch is in effect from Thursday morning through Saturday afternoon.
&&
.DISCUSSION...
The center of a kona low lies about 250 miles N of the Big Island
this evening, and has been quasi-stationary for the past several
hours. Widespread layered clouds with embedded showers and
thunderstorms prevail to the N and E of the low's center, while
scattered to broken showery low clouds prevail S and W of the
center, and upwind of the islands. The gradient between the low and
a strong surface high about 1000 miles NW of Kauai is supporting
moderate to locally breezy N to NE winds, strongest over Kauai and
Oahu. Afternoon soundings show that the island atmosphere remains
unstable, with relatively low PWAT between 1 and 1.3". Radar shows
small but heavy rain cores moving fairly quickly toward the S and SW
over the islands from Maui to Kauai, with a diminishing NW flow over
the Big Island delivering a decreasing amount of low clouds.
The short-term forecast anticipates the low-level flow becoming
light and variable over the Big Island as the kona low passing to
the N cuts off the winds. This will lead to clearing skies and land
breezes develop overnight, with a mostly sunny Wednesday morning
followed by afternoon sea breezes fueling upslope clouds and
showers, and possibly some thunderstorms. These will be added to the
forecast with an update that will be issued shortly. Light to
moderate winds will shift to the SE and S beginning Wednesday night,
beginning what is expected to be an extended period of deep-layer
moisture advection over the area, with a significant surge arriving
from the SE early Thursday morning.
The same general pattern with respect to the wind flow and moisture
advection will play out on the other islands as the low moves W,
with some timing differences. Moderate N winds on Oahu will diminish
Wednesday morning, becoming light and variable by the afternoon.
This could allow sea breeze circulations to drive heavy shower and
thunderstorm formation over the interior and/or S portions of Oahu
and Maui County. The atmosphere will remain unstable due to the mid-
level reflection of the passing kona low bringing steep low- and mid-
level lapse rates. By this time tomorrow night, the low will be
passing N of the Kauai, and SE to S winds will be developing over
all islands.
As the kona low moves W and further away from the islands, model
guidance has been persistently indicating that a stationary
convergent band will set up over the island chain, affecting all
islands from Thursday until at least Saturday. Strong SE winds will
feed deep moisture into the band, with the potential for heavy rain
to become terrain-anchored, or repeatedly train over the same areas.
Difficult to know how windy it will get over land in this regime, as
the smaller islands typically lie in the shadow of the Big Island in
SE flow, but there could be periods of gusty winds, especially in
showers. The mid-level low and associated instability will shift W
of the islands Friday and Saturday, but PWAT surging to nearly 2"
means that there will be a chance for thunderstorms, which could
also bring strong and erratic winds. A Flood Watch is in effect for
all islands starting Thursday morning. Now is the time to prepare
and/or
Bulletins, Forecasts and Observations are courtesy of Honolulu National Weather Service Forecast Office
Cheers (Cool ha they are now seeing it also.)
Looking reasonable in its modeling with trough that spawned the kona. Also note the subsidence
sinking air from herein across the pacific on the forecast.
Been quite awhile since i have tracked a tropical beast as photogenic as Freddy.
Not a good look further on in the current modeling tracks, being a very robust annular structured tropical cyclone as a rule of thumb they don't get affected very much by shear. May well end up being a humanitarian crises this one.
Has there been a better image taken from space than this. From the International Space Station :o
Wow, that is amazing.
Incredible!
So cool! Do you think north is up in the photo?
Yep.
Thanks for that.
So would the strongest winds be where the wave like features are on the SW flank?
Those are more so an indication of the convective cells around Freddy. Maybe a peak in moisture advected in from the north-eastern flank? Cruisin, will have more of an idea?
I'm not sure the exact time the image was taken but these ASCAT images from the weekend show the wind field being quite symmetrical, though with a wider fetch on its south-eastern flank.
Video of Freddy.
Funny where Freddy has ended up.
All bets were that it was going to be TCFred in the Coral Sea but it generated just before Gabrielle in the Indian Ocean and now looks to have kicked on all the way across to Africa…. Must be some sort of record travel distance?
Almost, the longest lived tropical cyclone for the Southern Hemisphere was Leon-Eline in 2000, with it lasting 18.5 days and travelling a similar path.
We're up to 16 days.
NWS / NCEP / CPC
20 February 2023
• An active MJO signal propagated from the Maritime Continent across the Pacific over the past
two weeks.
• Interference from various modes, including the ongoing La Niña, have resulted in a weaker
presentation of the intraseasonal signal, particularly in the zonal wind and OLR anomaly fields.
Outgoing Longwave Radiation (OLR) Anomalies
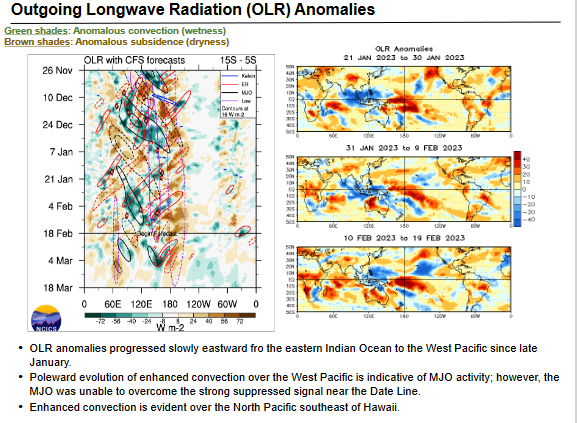
Green shades: Anomalous convection (wetness)
Brown shades: Anomalous subsidence (dryness)
• OLR anomalies progressed slowly eastward fro the eastern Indian Ocean to the West Pacific since late
January.
• Poleward evolution of enhanced convection over the West Pacific is indicative of MJO activity; however, the MJO was unable to overcome the strong suppressed signal near the Date Line.
Read myself into the latest official was mjo struggled again at the date line. Looking at some other things myself i don't think there was any kwave at a intensity worth noting in the kw generation area throughout this cycle.
The Spac disturbance being mentioned is brewing nicely atm its been tagged as 94.
Atm current modeling suggests it MAY go on to be the equivalent to a Aussie severe cyclone.
QUOTE
Global structure of the MJO
The MJO is not just confined to the tropics. Figure 5 shows an animation of the MJO cycle in 200-hPa streamfunction anomalies. Streamfunction is a measure of the circulation in the atmosphere. The wind blows parallel to streamfunction contours: clockwise around positive streamfunction anomalies (red shading), and anticlockwise around negative streamfunction anomalies (blue shading). 200 hPa is a pressure level in the upper troposphere, about 8 km above the Earth's surface. It is the level at which the jet streams are strongest, and the MJO streamfunction anomalies in Figure 5 represent changes to the position and strength of the jet streams. The animation in Figure 5 shows that the MJO signal is truly global, with planetary-scale Rossby wave trains reaching out from the tropical core region out into the extratopics and high latitudes.
South Pacific Convergence Zone (SPCZ). The MJO affects the route taken by extratropical cyclones that propagate into the tropics and trigger convection along the SPCZ

quote
Ocean component of the MJO
The MJO is not just confined to the atmosphere. It has a strong signal in the ocean, with warm sea surface temperatures (SSTs) leading the enhanced rainfall, and cool SSTs leading the reduced rainfall (Figure 6). This has lead to theories of the MJO based on coupled ocean-atmosphere interactions.
Whilst there are cool amon sst across the indo eq. It will likely affect future mjo's ramping up
in the indo. MJO's thrive over warm pools of water. Weaker mjo weaker wwb you think?..
Wow what’s with all the warmer water off NZ?
Marine heatwave.
You wouldn't read about it, well you can but Tropical Cyclone Freddy is still alive and kicking over near Madagascar.
It weakened to a tropical depression over land but has since drifted back east and is now at cyclone strength again. Maybe 26 days now?
Wow that's impressive, all the more it tracked east to west again the grain. What's the longest lasting TC?
Do they get renamed when transitioning? Freddy returns from the mainland as Frederica with some bad makeup and an adams apple.
Earlier micro pass on 36 H looks to be showing a established (core) with this system. Should blast off with that embedded already. I marked it with the arrow.
Satview right now looks insane..
http://satview.bom.gov.au/
Looks like some rapid developments over the last few hours.
WTXS31 PGTW 112100
MSGID/GENADMIN/JOINT TYPHOON WRNCEN PEARL HARBOR HI//
SUBJ/TROPICAL CYCLONE 18S (ILSA) WARNING NR 013//
RMKS/
1. TROPICAL CYCLONE 18S (ILSA) WARNING NR 013
01 ACTIVE TROPICAL CYCLONE IN SOUTHIO
MAX SUSTAINED WINDS BASED ON ONE-MINUTE AVERAGE
WIND RADII VALID OVER OPEN WATER ONLY
---
WARNING POSITION:
111800Z --- NEAR 15.7S 120.5E
MOVEMENT PAST SIX HOURS - 230 DEGREES AT 08 KTS
POSITION ACCURATE TO WITHIN 060 NM
POSITION BASED ON CENTER LOCATED BY SATELLITE
PRESENT WIND DISTRIBUTION:
MAX SUSTAINED WINDS - 080 KT, GUSTS 100 KT
WIND RADII VALID OVER OPEN WATER ONLY
RADIUS OF 064 KT WINDS - 020 NM NORTHEAST QUADRANT
020 NM SOUTHEAST QUADRANT
025 NM SOUTHWEST QUADRANT
025 NM NORTHWEST QUADRANT
RADIUS OF 050 KT WINDS - 030 NM NORTHEAST QUADRANT
035 NM SOUTHEAST QUADRANT
030 NM SOUTHWEST QUADRANT
035 NM NORTHWEST QUADRANT
RADIUS OF 034 KT WINDS - 065 NM NORTHEAST QUADRANT
065 NM SOUTHEAST QUADRANT
060 NM SOUTHWEST QUADRANT
060 NM NORTHWEST QUADRANT
The last JT estimate had it @ 80kts sustained /1min
Small core pineye hard to estimate.
Category 4 – 113-136 knots (130-156 mph; 209-251 km/h). Structural failure of some buildings. Complete roof failures on many buildings. Extreme storm surge damage and flooding. Severe coastal erosion, with permanent changes to the coastal landscape not unheard of. Hurricane force winds extend well inland.
Above is saffir Simpson scale not bom.
An absolute beast.
Rowley Shoals recorded gusts of up 235kmph this morning.
looking back over the sat data it did agree @ the time the cyclone did display a pin-eye for awhile.
2023APR13 044000 4.9 966.4 87.4 4.5 5.1 6.8 0.5T/hour ON OFF OFF OFF -26.91 -80.39 EYE/P -99 IR 39.1 -18.37 -118.82 ARCHER HIM-9 32.9
2023APR13 052000 4.9 966.4 87.4 4.6 4.9 6.7 0.5T/hour ON OFF OFF OFF -26.68 -79.66 EYE/P -99 IR 39.1 -18.41 -118.81 ARCHER HIM-9 33.
Now Cat 5(Bom)
Wow that was quick.
Actually not a 5 strength yet under BOM, but will be this evening. Is there under the Saffir Simpson scale but.
Here's an incredible pressure and wind speed trace from Severe Tropical Cyclone Isla.
Incredible data! 278km/h then gone..
Make that 289km/h!
That's mental!
Latest IR image, there's the eye..
"The last category five cyclone to make landfall in WA was Cyclone Laurence in 2009 which crossed the coast along the same stretch of Eighty Mile Beach where Ilsa is expected to cross."
https://www.abc.net.au/news/2023-04-13/wa-cyclone-ilsa-upgraded-category...
Wow! That's uncanny.
Incredible info crew, your the best.
Intense tc's in our region.
Still for me i have never seen a April tc or any for that matter in our area of responsibility that presented with the perfection of Severe Tropical Cyclone Monica. Tend to think it's still the benchmark in our aor.
https://www.atms.unca.edu/ibtracs/ibtracs_current/index.php?name=v04r00-...
If anyone believes there has been a better tc then pls post it just outta interest.
Cold water trace following STC Isla..
Great posts, thanks crew!
Was well modeled with its transitions.
Photogenic subtropical cyclone out there in the spac. Likely it be causing some noise with current SIO readings.
Next round cckw is brewing the indo.
Next round cckw is brewing the indo.
The ER in the cckw is going to spawn two tc's one each side of the equator mirroring each other thinks GFS.
Not sure why the double postings above are happening a glitch likely.
Jasper not looking to flash atm the tc got clipped by shear over the past few days.
Some models do think tho the tc will find another sweet spot as it approaches the far North coast.
Entry point ACCESS thinks will be Monday.
Access Global thinks the lower energy will position itself under a upper-level anticyclone sweet spot in the jet and may exceed what is expected with normal intensification.
Just my 2 cents atm.
Access Global thinks the lower energy will position itself under a upper-level anticyclone sweet spot in the jet and may exceed what is expected with normal intensification.
In laymans the access see's coalesce and aligned with a upper level outflow point into jet.
Leading to a stacked tc before landfall.
What's your feeling if she gets into the GOC Cruisin? Re-intensify? Water is pretty bloody warm in there atm.
Yeah i agree with that if the the vort gets its toes into the GOC and far enough into it away from any land friction it will likely re ramp up and maybe quite quickly again.
Yeah i agree with that if the the vort gets its toes into the GOC and far enough into it away from any land friction it will likely re ramp up and maybe quite quickly again.
Bom Official
................................................................................................................................................................................................................................................................................................
As previously discussed boms global model see's the tc under a upper-level anticyclone on approach.
latest 36H micro sample clearly shows and confirms Jasper still has a core.
And deepening on approach later this evening and early tomorrow morning.
Heavy tall storms (dark area) on the satpic are now again feeding into Jasper's core.
As you know Craig it's all about moving mass air. Plot above show's again now the system can now breathe in a sweet spot.
Maybe this storm will intensify @ a rate Dvorak will struggle with i think given how small the core has shrunk down over hours.
Maybe this storm will intensify @ a rate Dvorak will struggle with i think given how small the core has shrunk down over hours.
I should add to the above post due to the moist adiabatic ascent rate.
Enough from me now it's watch and see how it pans out from herin.
It's likely @ around T 3.5 curved band atm imo.
Latest ascat sampled 55kt.
When the atmosphere begins cool @ night i don't think the system will have much of a problem reaching the 64kts to be the equivalent to a entry level typhoon/ cat1 hurricane sshs.
As always take with a grain of salt and follow the official Boms calls if you are in any likely to be impacted area's from the system.
Love your posts Cruising, thanks.
Thankyou Sprout.
Asper multi satellite intensity Jasper did reach the 64kts tho it has weakened again.
Time is in N-H not Shem local.
https://www.ssd.noaa.gov/PS/TROP/mtcswa.html?storm=SH032024&id=JASPER&ti...
Nice.
Lost it's Mojo a bit ;p
Yeah its all about watching the radar herein with Jasper. Will it tighten? a little with the expected recurve SW dip before landfall?.
Not really applicable in this thread. So feel free to remove it.
Tomorrow is looking juicy stormwise. Maybe some heavy duty storms about.
The model is thinking there will be some very decent instability about.
Were some bangers last night!
Looks like jasper did tighten a little. Not overly strong but it's slow moving. Been 40-50kts at Low Isles since around 1300hrs, with the odd gust to 60!
Beautiful thanks, you've got all the tricks!
Interesting to see the remnants of Jasper are expected to linger in the Gulf of Carpentaria on the weekend and then feed off the the monsoon across the Arafura Sea, possibly resulting in another intensification back to a tropical cyclone to the north of the country mid-late next week.
If it does happen will they keep the same name?
Looks likely..
Pretty sure the system keeps the name Craig. TC Monica comes to mind of a similar track, just crossed the coast higher up the Cape..
GFS thinking atm the vortex will be meandering about in the GOC and sloppy until roughly
18th. The system then starts organising itself with the benefit of a good NW feed into the system. The model thinks around the 20th the system will have established an excellent upper-level outflow re 250mb screenshot.
850MB winds do filter down to the surface.
The model thinking is atm is it will get tight and be cranking again by next Wednesday.
Even tho the vort has been over land for a few days now it was still displaying a active cyan ring with some brightness to it on micro. In layman's it the low-level structure of the vort showing its still intact weak but active.
Most likely being aided with moisture input from a lingering equatorial rossby wave.
https://ncics.org/pub/mjo/v2/map/olr.cfs.all.global.10.png
I like the current GFS future track solution. Has howler potential if it verifies.
The the two big guns on the 00Z thinking is the vort is blocked by a building in ridge and can't enter the GOC.
Yellow to brown is ridge. Blue is troughs.
Now appears all the earlier model run's by most of the global models with a regeneration in the GOC all will very likely bust.