La Niña Is Here, Why Did The BOM Take So Long?

Why did the Bureau of Meteorology (BOM) take so long to call the current La Niña event?
Various other meteorological agencies called it many months ago. In all recent updates, the USA's National Oceanographic and Atmospheric Association (NOAA) has stated 'La Niña is present', similarly, the Japanese Meteorological Association (JMA) said, 'Atmospheric and oceanic indicators suggest ongoing La Niña conditions in the equatorial Pacific', and even the World Meteorological Organisation (WMO) said 'La Niña conditions in the tropical Pacific have persisted and strengthened as trade winds intensified during mid-July to mid-August 2022.'
So why did we sit on 'La Niña Alert' for so long when the indicators throughout the Pacific Ocean all sit above the appropriate thresholds.
It comes back to the baseline periods the signals are being compared to from agency to agency.
Firstly, the monitoring of the state of the El Niño Southern Oscillation (La Niña, El Niño or Neutral) is done by observing the difference in the surface temperature from 'normal' across the equatorial Pacific Ocean. That 'normal' being the thirty year climate average.
The region spanning the central Pacific Ocean gives the greatest indication of whether we're in a cool or warm water phase, and this is known as the Niño 3.4 region. The average temperature across this section of ocean is compared to the long-term climatic mean and this is where the crux of the issue falls.

The Niño 3.4 region spanning the central Pacific Ocean (combining yellow and red regions)
The BOM is comparing the temperatures across the Pacific Ocean to the 1960-1989 baseline, but thanks to climate change, sea surface temperatures have warmed slightly during the years following.
This has to be accounted for, as any drop in the surface temperature away from the current 'normal' won't be as great if using the older baseline.
The warming is only small and about 0.3°C through the Niño 3.4 region but the threshold for an El Niño/La Niña event is of a similar scale and +/- 0.5C respectively for global agencies, a touch higher and +/-0.8°C for the BOM.
This has an effect on the classification of such an event throughout the Pacific Ocean depending on which baseline you use.
The average temperature across the Niño 3.4 region from 1960-1989 was 26.79°C, but for the period 1990-2019 it was 27.1°C - a warming of 0.3°C.
Now, the Niño 3.4 reading for July 2022 was 26.59°C. That's -0.51°C below the 1990-2019 baseline, and falling into La Niña thresholds for NOAA and other agencies, but comparing it to the 1960-1989 baseline (which the BOM uses) it only comes in at -0.2°C, under the threshold for La Niña.
This is why the BOM's current classification differs from all other agencies. It's using an old baseline (along with a slightly higher threshold) which in the current ocean climate becomes irrelevant. On the other side it also makes the El Niño threshold much smaller, with the Niño 3.4 region only needing to warm up 0.5°C, which is inaccurate.
The August values for the Niño 3.4 region have just come in at 25.89°C, pushing us deep into La Niña territory, regardless of the baseline and threshold used. Using the older BOM baseline we've got a difference of -0.9°C, and with the more relevant climate baseline, a difference of -1.21°C.
With this latest data expect the BOM to issue a La Niña update any day, coming into line with most of the agencies around the world (they did just that on publishing this article).
Whether we see the BOM updating their baseline to a more current and relevant thirty year period is unknown, though my thoughts are these adjustments will need to be made in the near future for the alert system to remain relevant.

Sea surface temperature anomaly through the Pacific Ocean showing the clear La Niña cool signal. The Niño 3.4 region is shown in black. Source (NOAA)
Comments
Jeezuz.
It's been a classic (La Niña) SST anomaly distribution for months, glad to see BOM get in line.
Nice one Craig, you're definitely been ahead of the curve with these ENSO calls.
With significant impacts already -https://www.abc.net.au/news/2022-09-13/festival-of-the-port-sun-macquari...
Insurance. Bloody expensive if you can get it.
Interesting suchas.
Most long-range seasonal forecast models have the precipitation falling back to around normal ranges for the East Coast from January.
It looks to be wettest leading up to summer over the coming months.
The issue is with the soil moisture levels being near 100% for much of the eastern seaboard, any rain that falls won't be able to be absorbed, causing more run-off and flooding into already swollen/flooded catchments.
Western NSW also extremely wet from Neg IOD rainfall.
Flew over western NSW recently and it is amazing to see how green it is plus the water filled rivers and wetlands.
I think last time Lake Eyre filled was in the early 70’s, also a triple La Niña . The inland systems are currently wet and primed…. just needs a big low to drift down from the gulf in summer to deliver and it may fill again.
Hey Distracted I flew back from Bali to Melb in May/June 09 I think, or Feb 2011 and the all the country from Hedland to Melb was green, shiny, swirling with water courses and yep, Lake Eyre was full as a goog. Was absolutely amazing and lucky our flights to and from Bali were during daytime, so that on the way there everything was red, dry, normal then a couple days before we flew home a tropical depression dumped over most of the country, creating a beautiful and stunning transformation. I can't describe the joy and honour I still feel having witnessed this. Neg IOD rainfall perhaps..
The longer this wet spell goes on, the more I fear the following long dry spell. Craig, is this fear rational?
Qualitatively yes; a warming climate leads to a higher likelihood of more extreme weather events more frequently. I think the western US is experiencing extreme drought at the moment. Our millennium drought wasn’t that long ago - hope it doesn’t come back post the triple dip
The thought that this is all creating plenty of fuel for more big fires also plagues the back of my mind.
Totally, everything is going nuts so they'll need to get plenty of prescribed burning under way.
I reckon it is quite a rational fear. All these systems, El Niño/La Niña positive and negative IOD’s are simply patterns of oceanic heat dissipation. If there is more heat going into the system, I think it stands to reason that these systems will continue to amplify and perhaps more worryingly, though I am speculating a bit here, have a greater frequency of becoming more entrenched, ie more frequent triple dip La Niña, back to back El Niño etc. Perhaps this will be because as these systems become so supercharged with extra heat, they may override other more moderate weather cycles that help to bring a return to neutral conditions. I don’t really know but that’s the way I see it happening.
I think there is already a pretty good example of this type of heat induced ‘stubbornness’ in the atmosphere with the observed Hadley Cell expansion that has taken place over recent decades. The blocking effects of these gigantic highs are now such a familiar features of Australian winters and we see so little frontal activity north of about 35S nowadays. An interesting example of this can be seen this past winter in the exceptionally cold minimums for July in Alice Springs. Alice actually had a run of 15 days with a below 0 temp recorded! All due to stagnant high pressure systems keeping things clear an calm over the centre of the continent for weeks on end. Couple this with the increased incidence for positive SAM values and you have a recipe for the weather to remain pretty rigid at times over our part of the world. They reckon they have observed a similar pattern in Europe with the expansion of the Azores High, which has allowed hot, dry air from Africa to be fed increasingly further north into Europe over the summer,
hence the heatwaves over recent years.
So yeah, I think with more heat we will continue to see these large scale climate systems to be more intense with an increased probability for longer duration events. Which will be very worrying indeed if we get a longer El Niño/ Positive IOD type scenario than what we saw from 2017 - 2020
Great addition there SDW, lots of food for thought.
Nice work Craig, you're all over it.
Thanks Craig - the BOM should definitely update their baseline.
another 6 months of junk for the Surf Coast
Drowning in Tears.
Climate Change is belting insurance mobs & markets...
In today's world BOM boss State Premier/s to lockdown SEQ ahead of a sniff of severe weather.
BOM shut down SEQ for 2 mths/year beaches / Roads / recreation are secured off limits.
Perhaps only 50% of those calls are required...the rest is spooked by insurance.
BOM 3x La Nina / 2x Dipole declaration translates to a (Base level) > imminent Severe Event.
Rain imminent > Dams Full > Catchment Soaked > Creeks choked > Rivers banked > Seas Rising
This automatically triggers ALL Govt / Council / Emergency Response...(See : SEQ Severe Events)
Uni Experts : "Flood Watch calls over next 6 months
Govts / Councils > (Now!) Get Ready / Kits & Plans Emergency Refuge Campaigns
BOM prophecy > Greens send out their message bang on cue...like Gospel!
https://auspol.co/adam-bandt-australia-is-about-to-face-its-third-la-nin...
Bne is right now urgently handing out 3 weeks of Free Sand Bags (Yes Now! Hurry!)
NSW State Emergency Service issue Warnings urging people to prepare. (Now!)
Yes! Northern Rivers must prepare for Spring > Summer rain events!
https://www.youngwitness.com.au/story/7901477/aust-set-for-third-consecu...
Again! Soon as BOM pressed the Button...Bingo! It's game on!
*BOM La Nina Call > also instantly triggers an actual "Insurance Embargo" (Very real!)
( Imminent Event > immediately locks out Low lying / Storm Zone Insurance take up! )
Business must upgrade to "Interruption Insurance + adopt Emergency Plans!"
Commercial Property have new stricter urgent compliance for Roof / Entry / Windows / doors...(Now!)
Insurers Ramp up 2023 min cover & reduce share dividends.
(Yes! All this in today's news!) Can you feel the BOM power!
Oz BOM > US Stock Market Alarm Bells start ringing.
South American Corn / Soy Crops get written down
Next: China bully & up trade with South America to secure traditional stables Corn > Pork for Masses!
Oz East Coast Crops factor in Flooded shortage Supply lines as inflation soars > Interest Rates Soar.
Potentially stalling Xmas supply lines to ramp incoming Covid Wave! (Just keeps coming!)
Storm ravaged SEQ have lived under BOM orders for the last 5-10 years & jump when BOM says so.
We can share whatever BOM says instantly triggers Govt defensive reaction.
Climate Change BOM once ruled Oz...then came the Pandemic.
BOM Godz are simply returning to their thrones during the Pandemic Expert's Spring Break!
We could be looking at Govts walking a tight rope between Climate Catastrophe (vs) X Mass Pandemic
Only when Govt steady the line can BOM or Experts declare their next End of the World prophecy!
Just saying that not long ago World never cared wot BOM said...now the World revolves around them.
Oddly answers a lot as to why BOM pause for effect, without saying anything! A new world for sure!
Well, stimulating a policy of "greener" innovations is a positive for the other half million species that inhabit this planet
I am sure I read recently about triple La Nina events and it has occurred 3 times and they were 25 years apart 1998, 1973 and 1950 (these dates from memory)
Given the recurring similar cycle it is difficult to lay the blame entirely on climate change.
Anyway shit surf for SA for another year.
No link from me here regarding the triple-dip and climate change Oldman. Yeah looks to be a 20-25yr cycle of sorts.
Latest call from the BOM for the rest of the year ,,
Craig's question seems surreal & should answer itself.
Let's lay out the truths in a timeline to draw a conclusion.
Firstly! All the crew are on the same page as everywhere else in the world.
Meaning Climate Change is overwhelming & requires pro not past response.
Signs of the Times are examples of answering Craig's question & an excellent place to start!
Q&A : Political Sign of the Times Cartoon answers itself on a newscorp Kids News Page.
The point being...The answer is plain & simple & stares back at us! But we need to spell it out!
https://www.kidsnews.com.au/arts/of-droughts-and-flooding-rains/news-sto...
Political Cartoons have had a field day of Rolling out Flood Fire Fever Famine as one sad joke!
Catastrophic News Images are almost cartoon like by nature...again all spelling out the answer!
Frozen in Time Fire Sign
https://scontent.fbne6-1.fna.fbcdn.net/v/t39.30808-6/279909582_362834069...
Flood Warning Signs torched by Bush Fire.
https://content.api.news/v3/images/bin/3b4743e4c153254ad6233fce326ddbe9
Bushfire Warning Signs drowned out by Flood.
https://i.dailymail.co.uk/1s/2020/02/10/00/24520932-7984741-Weather_iron...
Emergency Centres are closed due to an Emergency
https://pbs.twimg.com/media/FMpgmWWacAA4WO_?format=png&name=small
https://www.australianpharmacist.com.au/pharmacies-destroyed-forced-to-c...
https://i.guim.co.uk/img/media/e71f0f600b67e949d9bae3f7adea3fd1f71ebd48/...
Droughts & Flooding Rains...we're all on the same page by nature but not in practice...How so!
Institution is a bit slower to change with the times...
Again! Back to basics...tbb said we gotta do this by the book in order to learn from our mistakes!
Australia States are institutions and resist change at all cost but Climate Change can't wait.
All states need to get on the same page like yesterday & at first glance seem to be ready...or are they?
AFAC : National Council for Fire & Emergency Services (So who's on board with that?)
1990 Qld / 1998 WA / 2005 SA ( Legislated as united Fire & Emergency coordinated Services)
Vic / NSW / Tas / ACT / NT Fire & Rescue + Emergency Service (Legislated as Separate mop up units)
Coordinated State or National or International ADF or Policing intervention is delayed by default.
Some could rightly argue it invites the BOM app to stick it together with a band aid solution.
tbb is not saying one hero outfit is better than another...victims are driving this policy change!
Again! We need to spell out the way it is to let the Question answer itself as it is now clearly doing!
Signs are pointing to NSW being most at risk but resistant to change...Are NSW delaying BOM?
Again! To answer this...we must stick to the timeline of events & not jump to conclusions!
21st June BOM Downgrade La Nina Event to WATCH ....+ Forecast 2022 La Nina Return
16th Aug ENSO call La Nina Event ( Craig Questions why there is BOM delay) Good Question!
[factcheck] Well on the very same day...something equally important happened in NSW?
16th Aug 2022 NSW Major Flooding Report is tabled in Parliament!
https://www.nsw.gov.au/nsw-government/projects-and-initiatives/floodinquiry
https://www.abc.net.au/7.30/flood-inquiry-report-co-author,-mick-fuller,...
Q: Did NSW Govt instruct BOM to hold their Fire by delaying call to prepare a Policing upgrade
[factcheck]
Recent Fire & now Flood Report findings (Demand) United Police / BOM Powers + Buy backs
We need to return to the Start Theme of Fire Flood Fever Famine as one message.
Answer : Universal Flood / Fire proof Disaster Sign { Welcome to Hell Hole of the Pacific }.
Developers slipped their Mayors brown paper bags to blow up Shark Towers...
Glow in the Dark [ End of The World Signs ] are going the way of iconic Shark Tower Views!
Oldschool caring, honesty & commonsense don't cut it in Tree/Sea Change Land Shark territory!
{ Welcome to Pleasantville no Climate Change disaster here...enjoy yer recovery! } All Sounds Nice!
2018 Latest BOM FDR ( Is already obsolete ) All new signs are being removed...Waste of Money!
&t=21sLow-Moderate > High > Very High > Severe > Extreme > Catastrophic (Code Red) > [Sign is Toast]
31st Aug 2022 AFAC > BOM app [ Australian Fire Rating System ]
https://www.afac.com.au/initiative/afdrs/afdrs-faqs
http://www.bom.gov.au/weather-services/fire-weather-centre/fire-weather-...
Signs are being replaced for Essential Digital Emergency Alerts
https://scontent.fbne6-1.fna.fbcdn.net/v/t1.6435-9/195727219_10159135339...
How effective are apps or digital messaging before or during Climate Catastrophes?
At risk Clients must subscribe to o/s Political Donor [f] Cartels or forgo last spot on the VIP Ark!
What about as next week's record disaster unfolds?
1,400 Telco Towers will melt in an Aussie Bush Fire
2,000 km Digital Roadside [ Biblical Hydraglyphs ] are circled by sharks
150,000 will lose Telco BOM app in Aussie Floods
100,000 will lose Power to charge any BOM app in Aussie Floods
Most at risk can't Vax in a Pandemic or Vote in Election or feed or drink or find clothes.
Signs are underwater or on fire + apps are off line during next & every new Disaster...Next Question?
But a BOM app is still favoured by Big Tech & Developers bankrolling Govts for Data Mining...durr!
SEOCON start implementing recommendations immediately > Police Dept Commissioner with BOM.
Talk of amalgamating Rural Fire & SES ruffled some feathers! ( CSIRO > Sea Temp got left out! )
https://www.themandarin.com.au/197345-two-nsw-agencies-to-be-established...
6th Sept BOM Weather app Wotz New *Fire Ratings (Tick!) *Flood Watch (Tick!) *Location (Tick!)
Apple / BOM > Flood / Fire Rating app ready + Commissioner Gordon BOM phone is ready.
BOM is ready! Sir! { 4.5 Stars }
https://apps.apple.com/au/app/bom-weather/id1100096880
13th Sept BOM call La Nina Event ( We can consider Police & BOM have had a Pizza & beer!)
Note:
SOE report was delayed 6 months from [L] > ALP
New Fed Govt have also delayed Covid Vax Review + Lowest Test'n'Vax > Weekly [+] Reports
Vic Govt haven't tabled Mid Year docs & won't meet Nov Election deadline.
https://www.theage.com.au/politics/victoria/most-government-financial-re...
Plenty more delays ahead...
Wash Up NSW reports
15th Sept *Southern Cross University Report into NSW Flood Rort...
Digs deeper...suggests people are being denied Pay Outs until delayed CSIRO May 2024 report!
https://www.wsws.org/en/articles/2022/09/15/ouyq-s15.html
16th Sept *NSW Police will recoup money @ Flood Signs Fines (Road Closed)
https://www.dailyliberal.com.au/story/7906273/about-saving-lives-police-...
13-16th Sept : $100m ( $44.3m Feds + $15m State > Nth NSW Primary Producers Flood Grant)
Norco $34.7m S'shine Sugar $ 12.7m Nth Coast Petroleum $ 4m Williams $ 3.7m Multitask $3.3m
https://www.nationaltribune.com.au/nearly-60-million-to-support-northern...
https://www.miragenews.com/nearly-60-million-to-support-northern-rivers-...
https://7news.com.au/news/disaster-and-emergency/bureau-of-meteorology-i...
No tricks there...Happy to share...crew can suss out the BOM delay in their own way!
This is interesting..
https://atmos.uw.edu/~rcwills/papers/2022_Wills_etal_SST_pattern_bias.pdf
Basically there has been cooling observed in the south-east Pacific and south-west Indian Ocean for the years 1979-2020, but this study shows that none of the Global Climate Model Ensembles could forecast it.
They did pick up the warming hot spots in the Tasman Sea and north-west Pacific as well as the Atlantic, but throughout the Pacific, there's been a bias towards El Niño for whatever reason, when the opposite has been seen.
With the warming climate we've actually seen a quasi La Niña setup with warming in the west and cooling to the east.
"Observed trends (per 41 yr) in annual-mean (a) sea-surface temperature (SST) and (b) sea-level pressure (SLP) over 1979–2020 from Extended
Reconstructed SST data set v5 (ERSSTv5) (Huang et al., 2017) and the ERA5 reanalysis (Hersbach et al., 2020), respectively. Modeled trends in (c) SST and (d) SLP
over 1979–2020, from the multi-model mean of simulations with 16 climate model large ensembles (LEs) (Table 1). The SST trends in each LE have been rescaled
such that their global mean matches that in ERSSTv5. Observed trends in (e) SST and (f) SLP over 1979–2020, expressed in ensemble standard deviations away from
the multi-model mean"
More here:
Will read it in full when I get a chance.
Any merit in considering the contribution from melting ice?
Yep, one of the hypothesis.
Interesting. Do you have any links to research / discussion on the topic that you could share?
This is from the parper mentioned above.
"Specifying observed extratropical winds or adding Antarctic meltwater forcing to a climate model both shift the SST trend pattern closer to observations (Dong et al., 2022), but discrepancies in winds or meltwater forcing could result from a biased/missing forced response or from multi-decadal variability, so the ultimate cause of the observed Southern Ocean cooling trend remains an open question."
https://atmos.uw.edu/~rcwills/papers/2022_Wills_etal_SST_pattern_bias.pdf
So it's still being researched, investigated.
Thanks Craig. Appreciate your effort to dig that up.
Due the shape of the continents it seems to make sense that that the meltwater would get pushed up the coast of south america at depth and contribute to the upwelling.
TBB... "To answer this...we must stick to the timeline of events & not jump to conclusions!" - unless I'm mistake, seems you might be. A series of events/outcomes don't tell you anything about causality or intention on their own.
Where'd you hear that insurers are placing embargos on new policies in response to the BOM's La Nina proclamation? Looks like you said something like that in your first post under this article. I work for well-known insurer, and such an embargo would be news to me and many others in our sector. Embargos are put in place for impending events (typically 48 hours before they "hit"). Implementing an embargo for La Nina has zero logic to it. It's a regional climate mode that describes a set of underlying conditions that last for multiple months, it's not a hazard event in and of itself, and it has no discrete location but rather applies to a general area of the planet.
The BOM is not intentionally driving any of this Federal, State or Local govt. Those entities have realised that they can share any blame (mostly blame, rarely sharing praise) with the BOM. This tactic is a means to deflect voter backlash and any potential future liability claims.
Having been involved in many sectors, it still bemuses me how much people underestimate the level of competence in some areas (e.g. the public service) and overestimate the level of competence (e.g. presence of large-scale multi-agency conspiracies).
Insurance Council declaration { 2022 La Nina Flood Catastrophe } = Immediate 2.5 - 4% Stock falls.
https://www.businessnewsaustralia.com/articles/suncorp-receives-5-000-cl...
Background Research Article.."Uninsurable Nation"
https://www.afr.com/chanticleer/la-ni-a-a-threat-to-suncorp-strategy-202...
* Past 20 years 10,000 Sydney Harbours of Ice melted to slow the Large Atlantic Current.
Should Northern ice melt continue it would render the collapse of the Conveyor Belt
Resulting in default Oz La Nina Flood Crisis.
https://newsroom.unsw.edu.au/news/science-tech/huge-atlantic-ocean-curre....
Global Insurance underwriters are losing money in Oz & are already beyond Capacity.
eg: IAG Insurance 'underestimated' 10/13 years Catastrophe Cover
2022 : (E/C La Nina Floods) Allowance $765m (IAG Reality = $1.11b)
Suncorp drew closer but are increasing premiums 10% highest since last SEQ 10 year La Nina Mop up!
DAE : 1/25 Aussie Properties uninsurable by 2030 due to Climate Change...(Qld 6.5% or 200k)
Coincidentally the same number of record 2022 La Nina Flood Claims
Should or when a Perfect Cyclone hit Goldie Hi-Rises it would smash Disaster Record > $20b damages
Q is posed : " Should Govts underwrite Climate Insurance the same as Banks / Oil / Big Pharma?"
https://www.afr.com/chanticleer/la-ni-a-a-threat-to-suncorp-strategy-202...
Rapidly Declining Oz insurance capacity would weigh heavily on "Govt BOM calls of imminent threat"
Typical punter is witnessing Govt BOM fast colliding with Bio Security State of Emergency...(Embargo)
Timeline ( reference : Date Stamp )
16th Aug ENSO call La Nina
18th Aug (Source ) News Insurance Article
[ Triple La Nina could result in insurance embargoes for Flood Cover ]
Innocent imminent shot over the Bow should BOM be hoisting their "La Nina Alert Flag"
No need to be an expert to see hoisting the "La Nina Flag" would raise o/s Under Insurance Premiums!
Meaning Govt would need to stoke up more payouts by default with any BOM La Nina Call = (Delay!)
News article implies when BOM La Nina Watch switches to Alert it triggers Embargo on flood risk policy!
(Likelyhood of the Weather Event returning is 3x the normal risk!)
EMB already implemented embargoes after recent La Nina event 2022 SEQ floods.
"Because flood was occurring or "Imminent" > Insurance do not typically cover for "likely events"
EBM : Restrictions on insurance was "Normal Practice" customers can also be subjected to a "no claims period" which may leave them unprotected in the event of a incident!
BOM : "Many East Coast Aussies know Soil's Wet, Rivers are high, Dams are Full + Above Avg rainfall coming, there is an (elevated risk of flooding across the East of the Country)!"
Note No mention of rISING seas & choked up Bars + Capacity GC Dredging on old price contracts?
tbb & everyone is under playing La Nina...rarely do any come close to monumental Crisis scale!
https://www.news.com.au/technology/environment/triple-la-nina-could-resu...
La Nina + IOD resulted in "Record" 2010 SEQ floods > 2022/23 being for a 2nd consecutive year!
PS: The current record timeline keeps true but ever changes, growing more shocking by the day!
Policy holders, Insurers, underwriters, BOM & Govt are swept up in a larger than life La Nina Crisis.
Simply for the same reason Govt wish to ignore the Pandemic away...Good luck with that!
Should tbb wish to trigger panic...that's pretty easy...(Try this!)
Oz Peak La Nina + Peak Pandemic rise as one...but no one dares combine them in one sentence...Oopsie!
Will BOM Pointer declare that a Peak La Nina Pandemic is imminent in coming season?
Would hardly shock any if that was the latest addition for the premium VIP BOM app.
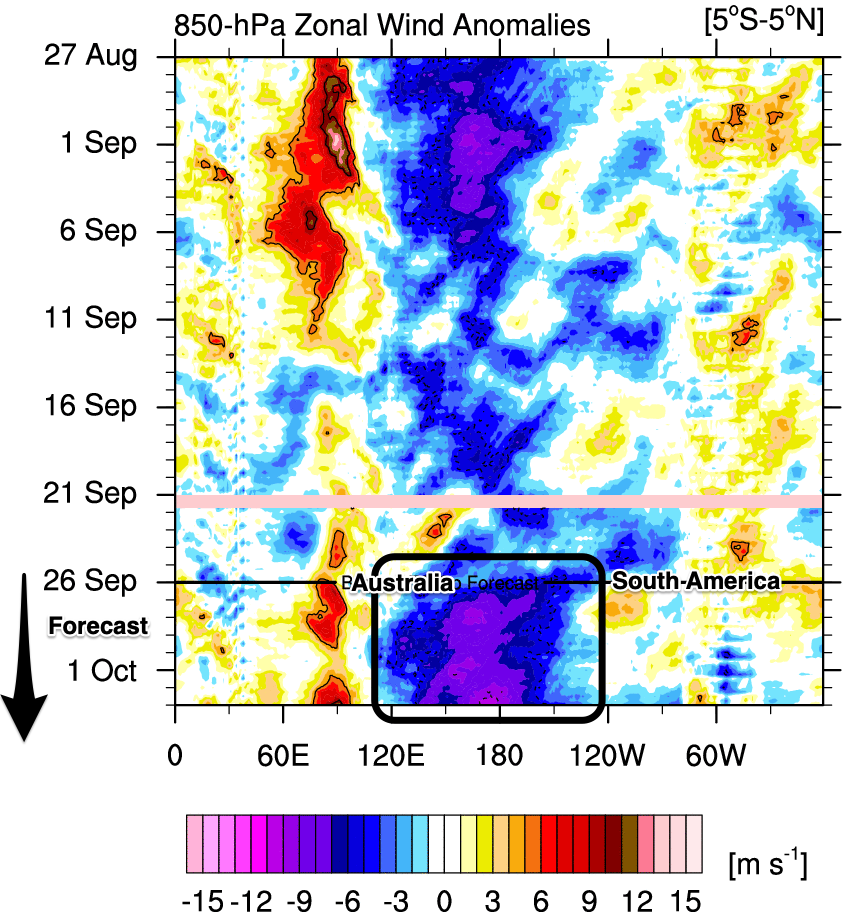
We've got a significant burst of stronger than normal trade-winds forecast over the coming week across the equatorial Pacific Ocean.
This will strengthen the current Niña signal.
Blue = stronger than normal east winds, purple = much stronger than normal east winds. Time runs from top to bottom, with the forecast for the coming week falling below the black line.
Latest SST anomaly looking ominous with some serious purple to the east and a very clear ‘wave’ pattern
Yep, quite significant.
The stronger than normal trade-winds are affecting one of the longest bird migrations in the world.
https://en.wikipedia.org/wiki/Godwit
Craig's open ended can of worms...how long is a piece of string.
Rules 1-100 > Record Pandemic + Record La Nina = Record poor Weather Data
2020-2022 Pandemic grounded 50-75% weather observations.
More importantly grounding these observations for long unexpected random intervals.
Weather Data blockouts were orchestrated by Politics of long & self discredited VIP Travel passes.
https://www.washingtonpost.com/weather/2020/05/12/weather-forecasting-co...
https://www.sciencedaily.com/releases/2020/07/200717101026.htm
First USA 2020 > Europe 2021 > Oz flight bans + Major Fleet reductions continue well thru 2022
Add to this WMO Anemometers are less sensitive & record more open data earlier.
BOM / Oz CASA install Anemometers in more particular "Measured" fashion.
Strict distance from traffic / Windows / Insulation / Native terrain beneath etc...
The obvious effect is a more particular delayed data than WMO ever ready swathe of oddball data.
By default BOM are more particular but suffered most recent & significant 2022 flight Data down time.
Basically ya got two opposing worlds of record poor data keeping in record La Nina Climate
BOM were likely & rightly double checking record poor oddball La Nina data as a lot banks on their call.
As Oz suffered heaviest loss of flight Data leading up to La Nina call...delay can be explained as fact.
Repeating from above...
Many news articles hang BOM La Nina call on driving Insurance / Banking / Farm / Stock / Migration!
Note US Govt covers Flood insurance where states mitigate.
US cancel NFIP debt $20b & covers less homes each year 5.5m > 5m
Oz Govt payments are on tap & banks are following US mandated Home Loan flood insurance.
For how long?
BOM predict 60-80% chance of East Coast above median rainfall Nov- Feb.
Ever so slowly drenching from southern > east coast back up to northern tip.
http://www.bom.gov.au/climate/outlooks/#/rainfall/median/fortnightly/1
Have you seen the BoM’s press release saying it resents being called the BoM and requests to be referred to by its correct title?
Cause that’s what’s important.
https://twitter.com/MartySilkHack/status/1582152407387361280?s=20&t=kJi-ZOnhrVXGumXQBzB4Gw
BOM's Meteoric rise to Fame.
{ Das Bureau } will constantly Alert Aussies as to when to cough up..."Emergency Pay Rates"
Usually brought on by Hazardous Peanut Allergy Season the day after that Abnormal Pollen Alert.
Everyday is an alarming new threat that requires 4x penalty rates for Das Bureau of Everything!
Beware "Das Bureau" now boss Emergency Services / Bio Security / Homeland Security
31st May 1981 Countdown Live Interview with The Bureau's Hit Man ...
The Bureau's Hit Man : "We felt we had to split with BOM & form a Super Group!"
1980's Countdown Interviewer : 'And is the Weather you're now predicting substantially different?'
The Bureau's Hit Man : "I'd like to think it was a Logical Development!"
The Bureau : Only for Sheep
Geno Washington is suing Dexys Midnight Runners who are suing the Bureau who are suing BOM .
Dexy's Duck'n'Cover Drill..."Too-ra-loo-ra Too-ra-loo-rye-ay!"
Hammer, nail, head bullseye from tbb sending it out of the park ...
'when you're awake you're asleep, yeah!'
Reciprocating with another forgotten classic (& solid parenting advice)
BOM delay... > Legitimate Excuses 1-100 Continues
As tbb said...Covid provides the ultimate long list of excuses for Delayed Forecasts or La Nina calls...
https://theconversation.com/weather-forecasts-could-become-more-challeng...
https://www.ncbi.nlm.nih.gov/pmc/articles/PMC7883092/
So how much does that affect BoM capacity?
Swear, was not even looking for such & stumbled over a long list of just that.
Note these are all justified measurable Oz climate data impacts...
BoM version...
* Network Availability was reduced to International Space/Sea sites being Offline for Extended Periods.
* With Bureau Staff were unable to Travel due to Covid Restrictions...(Global Frontline Exemptions?)
( 95% Target )
Services suffering ongoing out time...in order from most > least affected
Space Weather > Radar > Tsunami > BoM (Whole)
Services with Data loss "fluctuation" but fastest at coming back on line... in order from most > least
Satellite / BoM Super Computer / Sea Level / Wind Profiler / AWS
(Important Group)
Services operating at current grade % but with no available 2019/20 Data
Flood Warning / Upper Air Network
BoM's own Super Computer capacity was hit hard (67% 2020/21 ) 49% 2019/20
Note: It seems as if 3rd Party La Nina Geeks couldn't get Covid Exemptions to clear Fortress Oz.
La Nina Crisis Geeks couldn't get clearance from Pandemic Crisis Geeks.
Our Crisis Boss is bigger than your Crisis Boss...we all know how that played out!
Crew can suss that BoM Space / Satellite / Flood Mapping / Upper Air measurements were all at sea.
With 11% - 21.3% base Data variability clouding 2019-2022 BoM La Nina Data.
tbb is no teacher but son is studying to be one...
Teachers would grant extension for reciprocal 11-21.3% Calendar timed delay for 3rd La Nina report!
After All...tbb is bizarrely relaying this Climate data from Australian Government "Transparency Portal"
How was any Aussie meant to know we even had one of those...very forthright it is!
Seems to be big on Annual Reviews with much detail.(Could be handy for other Covid reviews)
Had to run a check on that...
2013 Act > 2018 (Pilot) > 13th March 2019 (Launch) "ABS Transparency Portal" (Pseudo Watchdog)
Here's the BoM transparency portal. ( Section 2 Performance Results ) Covers this review in detail!
Scroll midway down...(All Operational Systems meet agreed performance targets for uptime & capacity utilisation)
All Covid BoM Data anomalies are grouped together in one large nest they are...
https://www.transparency.gov.au/annual-reports/bureau-meteorology/report...
Real time Hypothetical Stress Test also warrants a delay in hollering Climate Driving La Nina Forecasts.
Any BOM Long Range Climate Crisis first & foremost...(NOW) falls under National / State Security.
BOM must first present a La Nina Climate Crisis to EMA who engage ADF.
Oddly Sept -Feb was the Timed Scenario > Current 3peat La Nina Event is then 'Stress Tested'.
In short...La Nina Stress Test plays out under State Lockdowns as in a Flooded Xmas Covid Outbreak.
Each State's preparations are then run thru the motions for stress testing.
Sure! BOM led National ( Flood / Fire / Tsunami / Pandemic ) hypothetical would also be configured.
tbb is not just guessing as Oz leads the world in all manner of freaky borderline quarantine exercises.
Also know that pre 2000 end of the world shelters were built in Oz...(One across the road from tbb)
BOM's goal is to deliver nationally consistent operations that seamlessly link function & capability.
This being across all states & programs to meet public needs.
In other words...Bom can't cry wolf or claim the Sky is falling until the safety net is first in place.
Crew all know why...because Natcab would look even more foolish if caught out in their pyjamas.
So only when BoM notify EMA to stress Test ADF / State Lockdown...can PM/Premiers kick on.
Once National Security threat La Nina Crisis is Stress Tested...only then can Media inform the people!
So we can imagine BOM had Covid data delay + Natcab secure Box Ticking before coming out.
2022 being the first real live test...the delay was also likely a little longer as it was our first Natcab drill.
The outcome being each Premier can be briefed for a strong safe secure response to La Nina crisis.
Holler La Nina all ya like because the A Team are already saddled up in their Thunderbirds.
Section 3 Group Performance {Community Services} Highlights & Significant Events.
( Providing a Strategic Advantage to Emergency Managers through Bureau Scenarios )
https://www.transparency.gov.au/annual-reports/bureau-meteorology/report...
Interesting to note that the TV news is reporting that "the bureau" have forecast an end to la Nina by late spring. Had a look at the announcement on the BoM website and it says the models indicate a return to neutral early 2023 (so assuming they could mean autumn).
If you remove BoM and EC outliers from the models, NINO3.4 forecast average points to February.
http://www.bom.gov.au/climate/model-summary/#tabs=Pacific-Ocean
Meanwhile, the purple blobs look they are making a comeback around the Galapagos.
Craig - what's the latest regarding the end to La Nina? Any updates?
It looks like it's peaking now, within the next fortnight.
Most seasonal forecast models have it breaking down fairly rapidly through summer, and back to neutral well before autumn.
Thanks mate for the quick response!
Strange one. Didn’t seem to produce a drop of rain in Queensland.
Now we just need the IOD and SAM to become past tense. And quick.
Wonder if it was because La Niña is peaking before the wet season and the weather systems aren’t conducive to rain, if it kicked on over summer it may have a bigger impact. Mind you there has been a shit load of rain in south west Queensland.
Yeah with the peak during winter and spring it's really focussed falls west of the ranges in NSW, and across the south-east of the country, combining with the negative IOD.
The charts in this article show this well. https://www.swellnet.com/news/swellnet-analysis/2022/11/08/october-in-re...
Hi Craig, what defines la nina as peaking?
The cold temperature anomalies throughout the equatorial Pacific Ocean, and namely the Niño 3.4 region.
It looks like we're seeing the end of the stronger than normal easterly trade-winds. This will reduce the cool water upwelling across the equator while at the same time, a strong warm water Kelvin Wave should start advancing east.
Here's the current state of the equatorial Pacific Ocean running from west (left) to east (right) with the sub-surface heat signal growing in strength.
Also NOAA's Niño 3.4 SST forecast.. La Niña is present when SST's are <= -0.5°C
OK gotcha, thanks.
The historic pentod graph that you've posted before shows a bit further back and it looks like the kelvin wave has been waiting to pounce for a few months. With so much colder than usual water still to the east, its hard to imagine those easterlies won't come back once this current southern ocean influence loses steam (a la June '22) Will watch with interest!
Ha yes, it's been building, though this heat content currently sitting there is much more pronounced than the one through the middle of the year and all global models are in alignment regarding a decline through summer.
Here's a better chart showing the evolution..
Mother nature always throws in a few curve balls though.
This graph has just come to light and forms the crux of the article above.
As you can see the base-line average temperature for the Niño 3.4 region has been increasing decade on decade since the 1960's. And with the BOM using the 1960-89 baseline (light blue), it's now irrelevant.
I wanted to be a meteorologist once, though seeing Bruce Willis in Armageddon changed my mind to a safer career.
An interesting development regarding basis of this article and the BOM using the old 30 year 1960-1989 baseline (which in a warming world is now irrelevant), and shifting it to the 1991-2020 climatology.
"In response to the above, and particularly the second point, this paper argues for the
adoption of more recent 30-year sea-surface temperature (SST) climatologies and
operational use of the Relative Niño 3.4 index to improve the Bureau's monitoring,
detection, and prediction of the El Niño–Southern Oscillation (ENSO) phenomenon.
Specifically, the Bureau should:
• Recognize that in a warming climate, any 30-year SST climatology is likely to
be too cool relative to the current climate state, leading to errors and
uncertainty in the real-time detection and monitoring of ENSO with respect to
the current climate state. This will generally result in an overestimation of El
Niño events and an underestimation of La Niña in real time when using the
Niño 3.4 anomaly index.
• As soon as practical, shift from using the 1961-1990 SST climatology to the
1991-2020 climatology in the calculation and discussion of current SST
anomalies. In the future, this climatology should be updated at a minimum of
every 10 years, in line with leading international National Meteorological and
Hydrological Services, and in accordance with World Meteorological
Organization (WMO) recommendations.
• To aid the real-time monitoring and prediction of ENSO, the existing standard
Niño 3.4 index should be augmented with the Relative Niño3.4 index, which
subtracts the tropical 20°S-20°N area-mean anomaly from the Niño 3.4 index. It
is recommended that these anomalies are computed using a baseline f rom the
most recent 30 years, and that the relative index be used for future ENSO
definition.
REVISING THE BUREAU'S ENSO ALERT SYSTEM: ADAPTING INDICES IN A CHANGING CLIMATE
2
• While noting that Niño3.4 index continues to be used widely, these should
continue to be computed, but provide secondary information for the definition
and communication around El Nino and La Nina events."
http://www.bom.gov.au/research/publications/researchreports/BRR-083.pdf
Interesting that we've got a positive IOD and the beginning of an El Neeeenyo, but the Indian Ocean is still pumping out rain across the bottom of the country every couple of days.
Combined with those Highs in the Bight dragging up the cold air and it's feeling almost exactly the same as this time last year.
Yeah the atmosphere hasn't been fully coupled to the SST El Niño signal signature as of yet, hence the different flavour.
Ah, takes some time for the effects to be felt. Interesting, ta.
Also worth mentioning that there was a delay for the onset of the first La Nina phase in the recent trio.. we went on official "watch" in June 2020 .. but by mid-Jan 2021 it really hadn't shown - resulting in Craig's article "La Niña, where the bloody hell are ya?".
Again, the ocean/atmosphere was decoupled for quite some time. But once it settled in...
https://www.swellnet.com/news/swellnet-analysis/2020/06/25/analysis-la-n...
https://www.swellnet.com/news/swellnet-analysis/2021/01/14/la-nina-where...