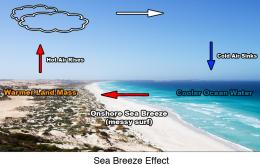
Swellnet Analysis

Axis of Evil

Swellnet Analysis

Axis of Evil

Swellnet Analysis
Craig Brokensha

The most interesting, and also the best, characteristic regarding low pressure systems that form close to the coast are the wide range of winds available in a very short stretch of coastline. The following lesson is something to keep in mind the next time a similar sytem strikes.

Large swell too early for the Volcom Fiji Pro

Swellnet Analysis

Large swell too early for the Volcom Fiji Pro

Swellnet Analysis
Craig Brokensha

At last year's Volcom Fiji Pro a huge, clean swell hit Cloudbreak on Day 6 of the waiting period. Sets were breaking in the 20 foot range under light offshores creating mindlessly perfect conditions - everyone has seen the photos and videos! The contest got canned so the Top 34 stepped aside allowing the spotlight to fall on the world's best big wave surfers.

The Buoys Light Up: The wonderful Directional Spectra

Swellnet Analysis

The Buoys Light Up: The wonderful Directional Spectra

Swellnet Analysis
Stu Nettle

Rather than the traditional X-Y line graph that can only chart one swell at a time, the Directional Spectra is a 360 degree screen that registers every swell in the water by its direction, its energy, and its period. This represents a significant leap forward. Whereas the line graph could only plot the most dominant swell in the water, the Directional Spectra chronicles multiple swells.

Buoys Follow One Direction

Swellnet Analysis

Buoys Follow One Direction

Swellnet Analysis
Craig Brokensha

Victoria's Surf Coast is uniquely positioned with a broad swell window to the southwest, however incoming swells are refracted as they round Cape Otway. This narrows the apparent swell direction at the coast, so when viewed from shore the majority of swells appear to arrive from the south. So how can you tell if there's a westerly swell or a southerly swell running through Bass Strait if they all appear to be arriving from a similar direction at the coast?